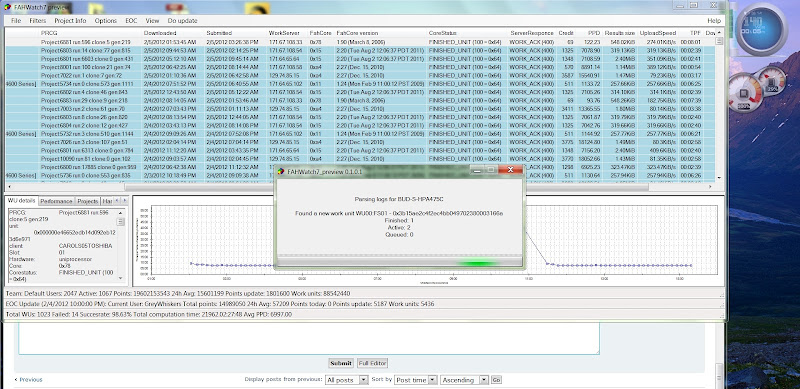
The pop ups are error messages, disabling them would make it easier for you to ignore them and not report them to me. If you're getting them back to back, please run with the debug shortcut and send me the fahwatch7 log file.
But, the first error in your screenshot I already fixed ( not in the cleanest way but it works

). The second error I have to check. The dll's don't have the most verbose log output, and the debug flag is not used by them.
Back to the popups, as I said they are there to make sure I get reports of errors ( eg they are meant to be incentives to post the logs, or better yet if one can replicate the error by doing certain stuff then quit, restart with debug shortcut and then show me the log

). But, I can look at the option to dismiss certain messages based on their origin and contained error so that
after and error has been reported you can opt to not get popups for them.
Also, the icon in your tray can be removed by double clicking on the logfile content at which it will ask to 'clear the warning?'. If you don't clear the warning, if you minimize or try to close the log it will go back to the tray with its warning icon. Also, if you're getting lots of messages in a row, don't clear the warning as a new error will play the application error sound ( and hearing that to often is really annoying ).
The lumping together, true in the list of projects. But the project statistics should at the least show the avg ppd and avg tpf of a project of both clients since they run on different hardware ->

It does not show the number of completed vs failed ( giving success % ) per hardware, I'll add that. *Note that it differentiates due to slot type, so if you have multiple smp:x rigs their are combined, and multiple uniprocessors will also still be lumped together.
The other solution is to use the 'edit filters' form. Add a filter for
Code: Select all
WHERE Client = 'xxxxxxx' AND Project = 'yyyyyy'
and a filter for
Code: Select all
WHERE Client = 'zzzzzzz' AND Project = 'yyyyyy'
Where yyyy is your project number and x and z are your client names.
I should really put that dialog to work I showed in the other thread to help set up different filters.


Or I should just use a filter maker using combo boxes with logical operators and field names, and maybe try to put the possible values in a autocomplete collection. Which is basically the same as above but without the need to go through different panels so some might find that easier.
Or I could go back to stacking selections.
Right now I'm working on the delegate factory in combination with a new application context, which will allow me better control over which form should receive messages.
Edit:
This is why that 'active' form tracking is of importance


and this is why I need to fix the current code

Code: Select all
[2/5/2012] * 1:27:29 PM - CRITICAL: Exception has been thrown by the target of an invocation.
[2/5/2012] * 1:27:29 PM - CRITICAL:  - Err.source: mscorlib Line: 0 - Err.number : 5
[2/5/2012] * 1:27:29 PM - CRITICAL:  - Err.description: Exception has been thrown by the target of an invocation.
[2/5/2012] * 1:27:29 PM - CRITICAL:  - stacktrace:    at System.RuntimeMethodHandle._InvokeMethodFast(Object target, Object[] arguments, SignatureStruct& sig, MethodAttributes methodAttributes, RuntimeTypeHandle typeOwner)
   at System.RuntimeMethodHandle.InvokeMethodFast(Object target, Object[] arguments, Signature sig, MethodAttributes methodAttributes, RuntimeTypeHandle typeOwner)
   at System.Reflection.RuntimeMethodInfo.Invoke(Object obj, BindingFlags invokeAttr, Binder binder, Object[] parameters, CultureInfo culture, Boolean skipVisibilityChecks)
   at System.Delegate.DynamicInvokeImpl(Object[] args)
   at System.Windows.Forms.Control.InvokeMarshaledCallbackDo(ThreadMethodEntry tme)
   at System.Windows.Forms.Control.InvokeMarshaledCallbackHelper(Object obj)
   at System.Threading.ExecutionContext.runTryCode(Object userData)
   at System.Runtime.CompilerServices.RuntimeHelpers.ExecuteCodeWithGuaranteedCleanup(TryCode code, CleanupCode backoutCode, Object userData)
   at System.Threading.ExecutionContext.RunInternal(ExecutionContext executionContext, ContextCallback callback, Object state)
   at System.Threading.ExecutionContext.Run(ExecutionContext executionContext, ContextCallback callback, Object state)
   at System.Windows.Forms.Control.InvokeMarshaledCallback(ThreadMethodEntry tme)
   at System.Windows.Forms.Control.InvokeMarshaledCallbacks()
   at System.Windows.Forms.Control.WndProc(Message& m)
   at System.Windows.Forms.ScrollableControl.WndProc(Message& m)
   at System.Windows.Forms.ToolStrip.WndProc(Message& m)
   at System.Windows.Forms.StatusStrip.WndProc(Message& m)
   at System.Windows.Forms.Control.ControlNativeWindow.OnMessage(Message& m)
   at System.Windows.Forms.Control.ControlNativeWindow.WndProc(Message& m)
   at System.Windows.Forms.NativeWindow.DebuggableCallback(IntPtr hWnd, Int32 msg, IntPtr wparam, IntPtr lparam)
   at System.Windows.Forms.UnsafeNativeMethods.DispatchMessageW(MSG& msg)
   at System.Windows.Forms.Application.ComponentManager.System.Windows.Forms.UnsafeNativeMethods.IMsoComponentManager.FPushMessageLoop(Int32 dwComponentID, Int32 reason, Int32 pvLoopData)
   at System.Windows.Forms.Application.ThreadContext.RunMessageLoopInner(Int32 reason, ApplicationContext context)
   at System.Windows.Forms.Application.ThreadContext.RunMessageLoop(Int32 reason, ApplicationContext context)
   at System.Windows.Forms.Application.DoEvents()
   at FAHWatch7.frmLive.SetMessage(String Message) in H:\FAHWatch7 Logparser test\FAHWatch7\frmLive.vb:line 161
[2/5/2012] * 1:27:29 PM - Log parser took 0 Days, 0 hours, 0 minutes,9 seconds and 963 milliseconds
 ).
).


